
Aave's Liquidators
Liquidators are one of DeFi's vital organs, ensuring the health of Collateralised Debt Positions (CDP) to prevent lending protocols from accumulating bad debts. In this post we use Pangea's AI and SQL Framework to dive into the data on Aave's liquidators to understand more about their role in DeFi's largest lending protocol.
How Liquidations Work
In Aave, users supply collateral assets (e.g. WETH) to borrow other tokens (e.g. USDC). Each collateral type has a maximum Loan-to-Value (LTV) ratio, which defines how much can be borrowed against it. For example, with an LTV of 80%, $1 of collateral supports up to $0.80 in borrowing. The protocol tracks safety using the Health Factor (HF), calculated as the value of collateral multiplied by its weighted liquidation threshold, divided by the total borrow value. HF above 1 means the position is safe; below 1 means it has exceeded its borrowing capacity.
When a user’s HF drops below 1, their account becomes eligible for liquidation. In this process, a liquidator repays part of the user’s debt and seizes collateral at a discount. To incentivize liquidators, Aave grants them a 'bonus' meaning they receive more collateral than the debt value they cover. The seized collateral is typically sold immediately, allowing the liquidator to realize a profit equal to the liquidation bonus minus transaction costs.
Although Aave liquidations are open to anyone, in practice they are dominated by specialized players. Competition is intense, as multiple liquidators attempt to capture the same opportunity, and success often depends on paying block builders to prioritize transactions. This bidding war for execution erodes profits, creating a race to the bottom where only the most efficient liquidators with the lowest acceptable margins remain competitive.
Liquidation Data
As part of our work to better understand DeFi's yield landscape, we used Pangea's new SQL and AI Framework to index all liquidation events on Aave V3 and generate insights. This tool makes it easier than ever to gather raw blockchain data, transform it into usable data, and then analyse and visualise it for specific insights.
Looking at liquidations over time, we see that by far the largest event was August 5th 2024, where over $231m was liquidated following a sharp drop in prices. Over $170m as liquidated on February 3rd 2025, followed by more large liquidations as prices continued falling to the low in April following the 'Liberation Day' introduction of Trump's tarrifs.
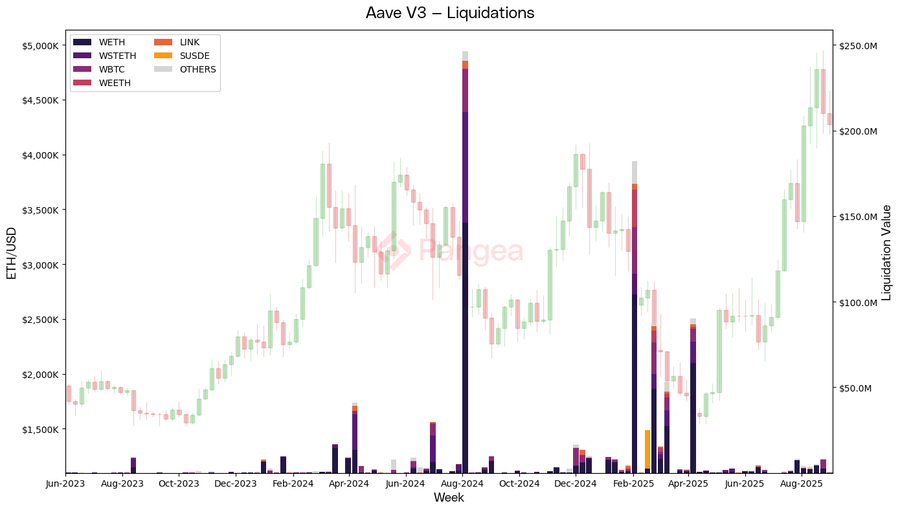
We can categorise these liquidations under two regimes: unexpected volatility (as seen in Aug-5th, Feb-3rd), and capitulation when volatility isn't necessarily high but price is grinding low (Mar-Apr '25). On Aug-5th ETH traversed over 2σ of realised volatility, putting it into the extreme 2.5–5% probability regime. These unexpected moves catch traders off-guard, touching liquidation prices that might have been considered a safe distance away.
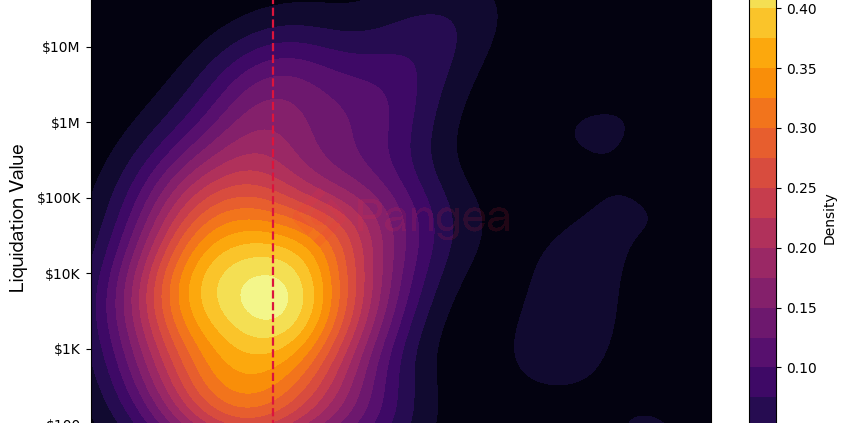
Understanding volatility is key to assessing how at-risk a position is. In the below chart, we map ETH and ETH derivative (e.g. wstETH) liquidations against ETH price volatility. Surprisingly, we find the majority of liquidations to be below the median volatility, although many of these are smaller positions <$10k. We find the largest liquidations at significantly higher levels of volatility (>0.8).
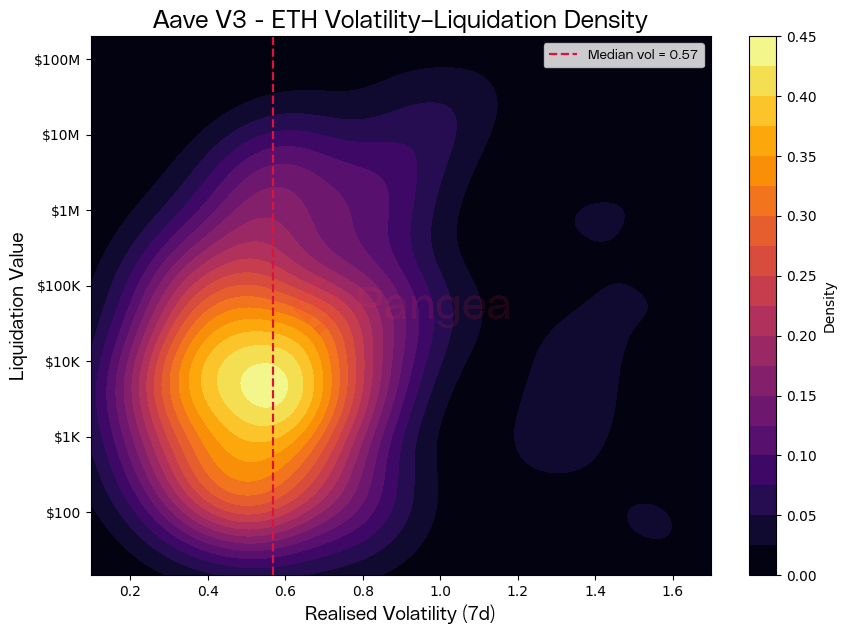
This suggests a bifurcation in liquidation dynamics: small retail-sized positions are steadily flushed out even under “normal” volatility regimes, while institutional or whale-scale liquidations cluster during stress events when realised volatility spikes above 0.8. In other words, routine market chop bleeds smaller players, but true volatility shocks are required to crack the largest positions, leading to multi-million-dollar cascades. The density ridge at sub-$10k liquidations around 0.4–0.6 volatility highlights this baseline churn, whereas the tail of the distribution confirms that systemic liquidation risk is disproportionately concentrated in the far-right tail of volatility.
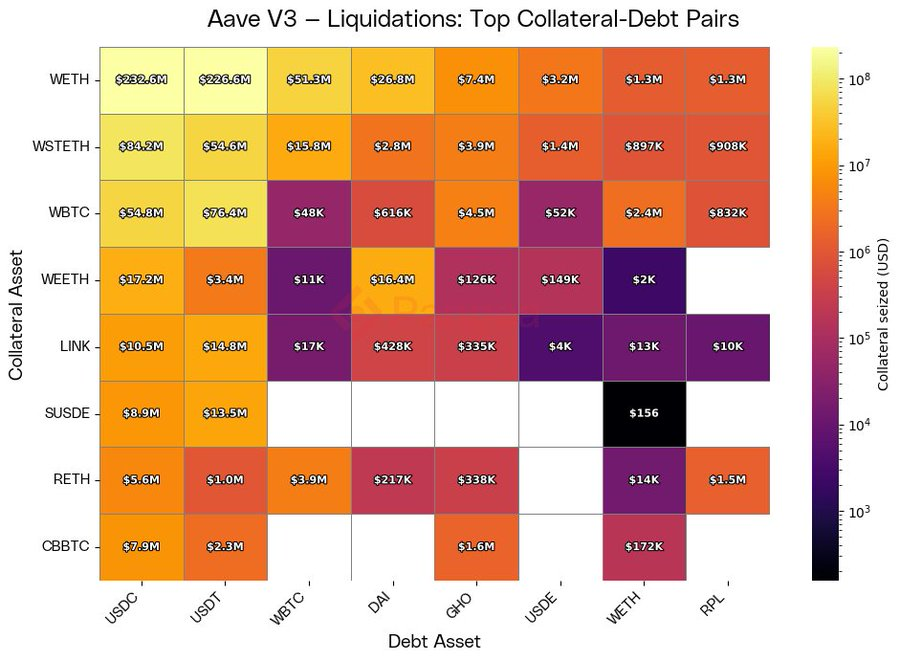
When a user is liquidated, the collateral asset they used to borrow against is seized and their debt asset is repaid. In the below chart, we looked at the top collateral-debt pairs in liquidations to understand common borrowing patterns. Unsurprisingly, the largest concentration comes from ETH-based collateral (WETH, wstETH, WBTC) being used to borrow stablecoins such as USDC and USDT, which account for hundreds of millions in seized value. This reflects the dominant strategy of pledging volatile blue-chip assets to gain dollar liquidity. At the margin, however, we see meaningful liquidation activity in ETH–ETH derivative loops (e.g., wstETH used to borrow WETH) and in the USDC/USDT-SUSDE 'Aavethena' looping strategy.
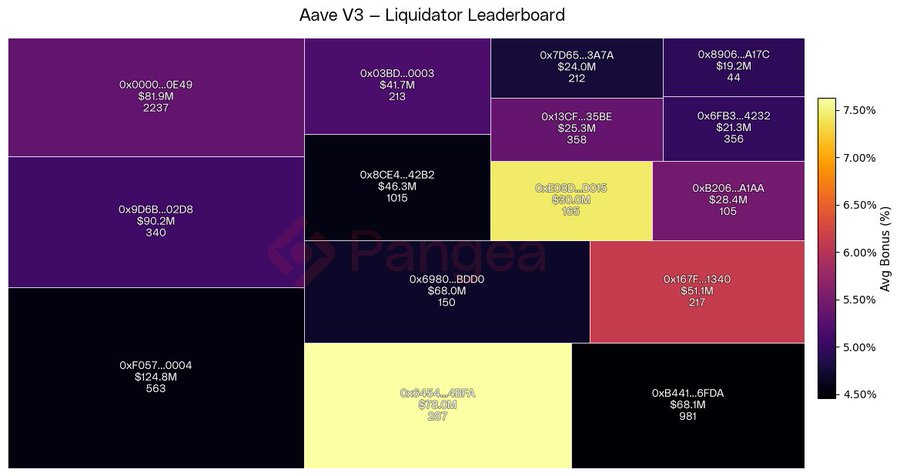
Looking at the liquidators themselves presents an interesting picture. 0xF057 leads with over $124m in seized collateral yet has only been active since the start of 2025 and is far from being the most prolific, with 563 total liquidations. By contrast, addresses like 0x0000…0E49 and 0x8CE4…42B2 have executed thousands of liquidations across a longer horizon, steadily accumulating volume through persistence rather than outsized trades.
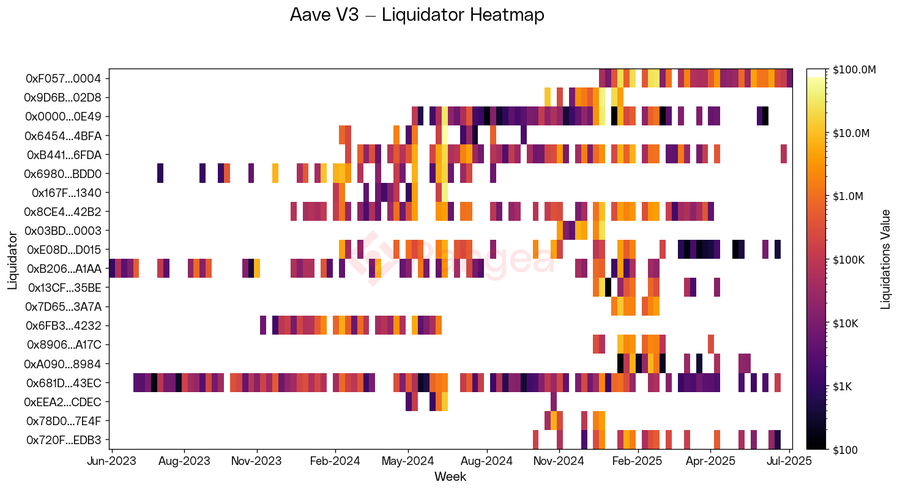
The heatmap highlights these different styles: some liquidators cluster around short bursts of high-value liquidations, while others exhibit consistent activity week after week. This heterogeneity suggests that the liquidation market is not dominated by a single strategy but a mix of opportunistic whales and systematic arbitrageurs.
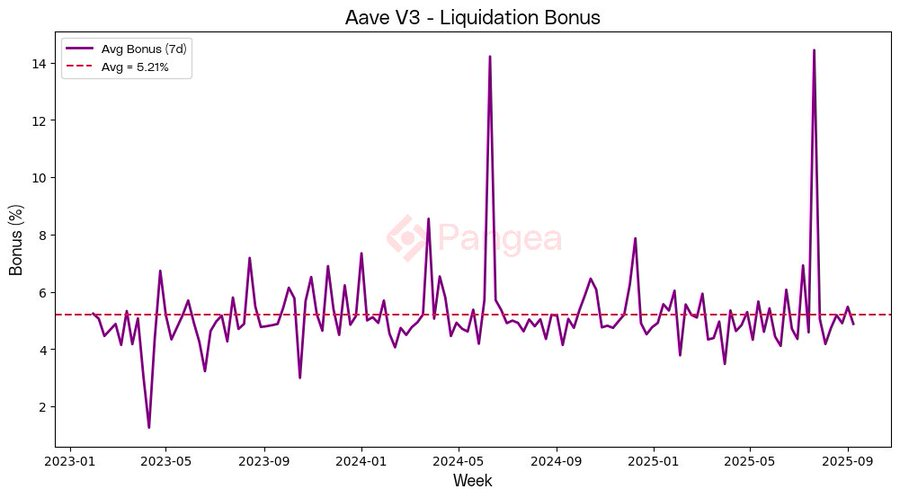
The liquidation bonus — the extra margin liquidators earn on seized collateral — averages around 5.2%, with notable but infrequent spikes above 10% during periods of market stress. These spikes represent moments when liquidators were rewarded far beyond the baseline.
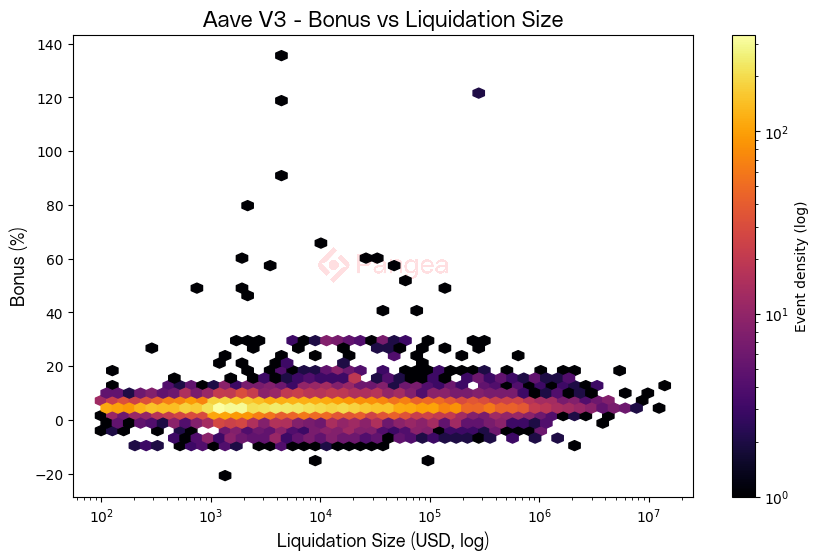
When viewed across liquidation sizes, the bonus appears relatively size-agnostic: most events cluster tightly around the 0–10% range regardless of notional value, from $100 liquidations up to multi-million-dollar ones. Extreme outliers with bonuses exceeding 50% are rare, suggesting that while the protocol can occasionally deliver windfall rewards, the liquidation mechanism is generally efficient and disciplined across scales.
Conclusion
Liquidation activity is not random chaos but a structured process shaped by volatility, collateral composition, and the incentives of liquidators. We see that large liquidations cluster around episodes of sharp price moves, yet the majority occur under moderate volatility, often affecting smaller accounts. Collateral–debt pair patterns reveal the leverage habits of borrowers, while liquidator leaderboards highlight a concentrated set of players capturing the lion’s share of opportunities. Finally, the bonus analysis shows that despite occasional outsized spikes, liquidation rewards hover tightly around 5%, underscoring both the efficiency and predictability of the system.
Our research reveals a robust protocol capable of handling nine-figure liquidations during periods of extreme volatility to safeguard the health of the protocol. Liquidations serve as a disciplining force: punishing over-levered positions, rewarding those who step in to restore solvency, and ensuring that Aave’s credit markets remain resilient even under stress.
You can read our other related blog posts based on our Aave dataset, where we put Aave's growth under the microscope and present our DeFi Heat Index based on stablecoin lending rates. All the charts and analysis you see here were put together with our upcoming SQL and AI Framework, which we'll be sharing more details about soon. If you want to get access to our Aave dataset, join our Discord or drop us a DM.