
DeFi Heat Index
"If you can't take the heat, get out of the kitchen!"
Unlike TradFi where credit risks are often hidden, the unparalleled transparency of DeFi allows us to gain unique insights into real-time market dynamics. Pangea enables this analysis through easy access to usable on-chain data, making it easier than ever to build advanced indicators. In this article, we introduce the DeFi Heat Index, coined by our efforts to make DeFi intelligible to more users. This indicator compares the Aave USDC borrowing rate against the Ether price relative to historical trends to indicate when the market may be overheating with leverage. We explain how analysing the relationship between prices and rates might help us to better understand on-chain credit cycles and provide context to market moves.
Credit Cycles
Asset prices have an important relationship to borrowing rates. In TradFi, the cost of credit is driven by the central bank’s 'risk-free rate'. As the risk-free rate rises, leverage becomes more expensive whilst capital is able to earn higher risk-adjusted returns in money markets, creating headwinds for risk assets like crypto and equities. Conversely, a lower cost of credit provides cheap liquidity to fuel market rallies, whilst asset managers are forced to allocate to riskier assets to achieve competitive returns.

Many factors affect asset prices, but the profound influence of rates upon market liquidity makes them a reliable macroeconomic indicator for the big picture of market cycles. As can be seen in the below charts, declining rates during 2019 to 2020 coincided with rising equity prices. The shock of the COVID-19 pandemic crashed markets worldwide, but central banks responded by dramatically lowering rates for an extended period, during which risk assets had an astonishing run. By early 2022 rising yields marked a local top for risk assets. Since 2024 we’ve seen lowering rate expectations and rising prices across crypto and equities.
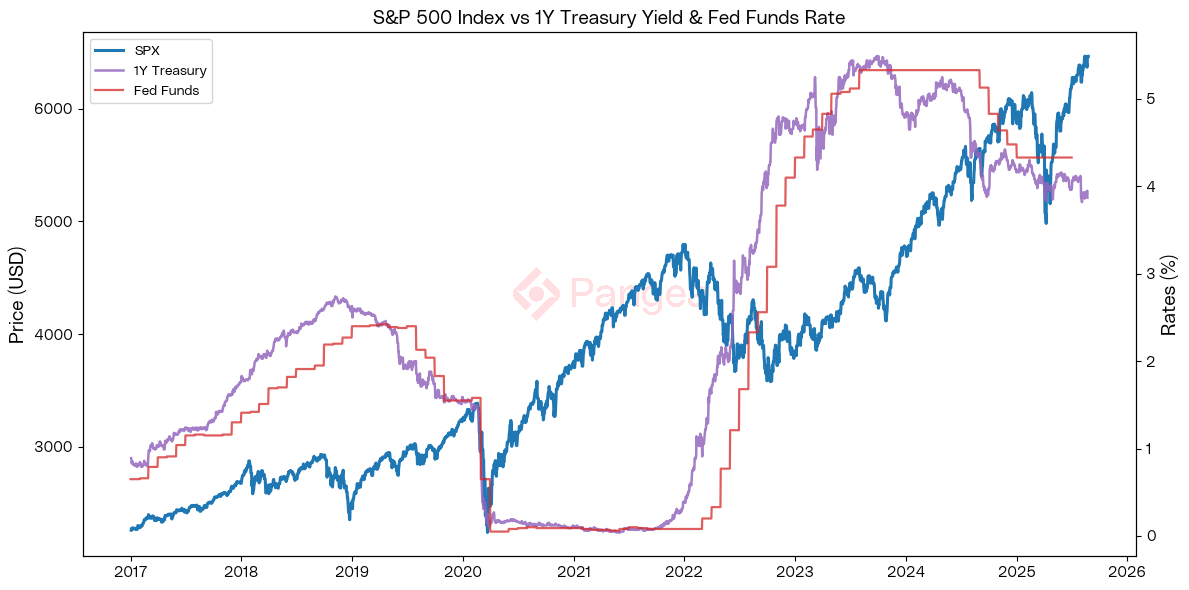
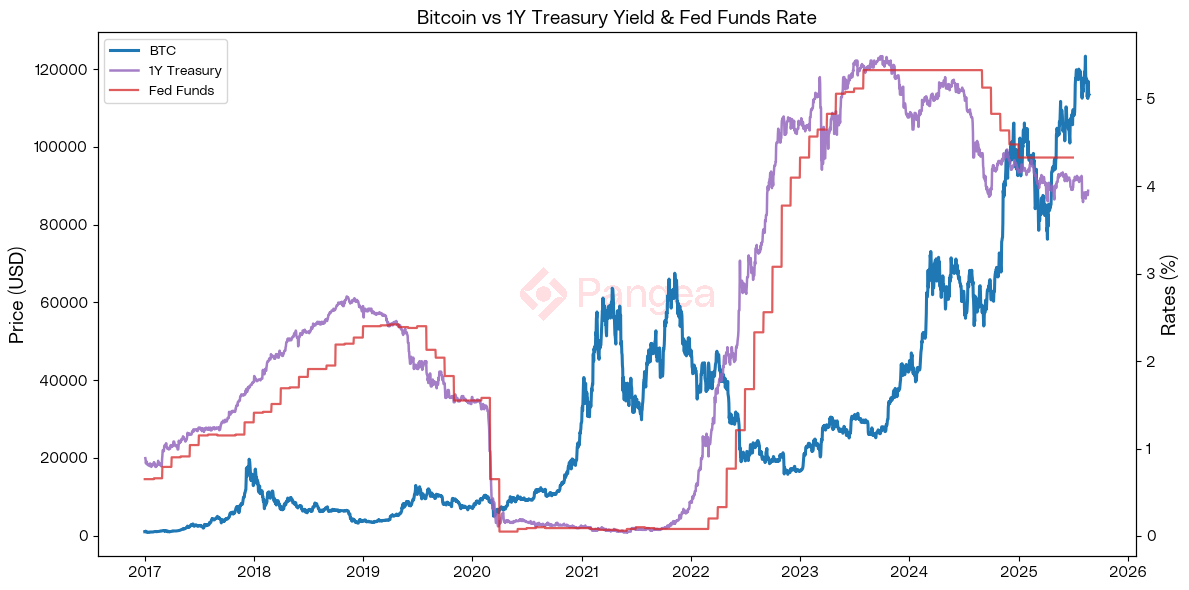
The periodic expansion and contraction of available credit - known as the credit cycle - is a key factor driving the boom and bust of the business cycle and thus asset prices. Markets go through their hot and cold seasons, and just like farmers, predicting these climactic changes is crucial for asset managers to achieve bumper harvests year-on-year. Interest rates and prices are key measurements for taking the temperature and understanding which season we are currently in.

DeFi Rates
In TradFi, borrowing rates are driven by the central bank rate, known in the US as the Fed Funds rate. The yield on Treasury bills gets priced by the market through auctions, reflecting expectations for the average Fed Funds rate over the duration of the bond. This risk-free rate then determines the rates set by downstream lenders, such as retail banks.
In DeFi, lending protocols like Aave automatically manage dynamic borrow rates based on market utilisation and risk parameters. Due to the perceived maturity and safety of Aave as a protocol and USDC as an asset, the Aave USDC liquidity rate has arguably assumed the position of being DeFi’s ‘risk-free’ rate on dollars - a place to park unallocated stablecoins and collect a baseline level of yield.
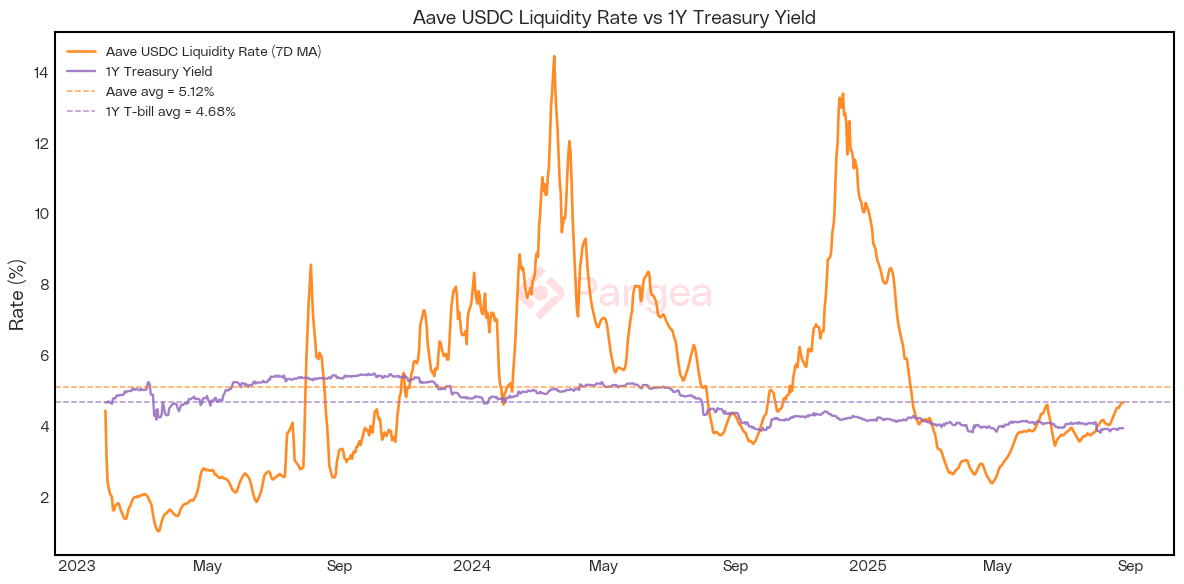
We can see from this chart that the Aave USDC lending rate is far more volatile than Treasury yields. However, at 5.12% the average liquidity rate since the launch of Aave V3 has remained reasonably close to the average risk-free rate of 4.68%.
This reflects an interesting property of DeFi rates; on the one hand, day-to-day changes reflect endogenous causes and microeconomic factors within crypto markets, whilst exogenous rates and macroeconomic factors have a structuring effect on DeFi rates as a whole. TradFi rates determine risk-appetite and the cost of off-chain borrowing, which ultimately drives dollar inflow. Meanwhile, crypto markets have their own internal structure, with idiosyncratic events driving short- to medium-term moves in the market. The relationship is asymmetric: TradFi rates impact DeFi rates, but not (yet) the other way around. DeFi is, in a sense, a world within a world.
Aggressive price rallies in crypto have often been driven by leverage. As the market turns bullish, traders borrow stablecoins against crypto collateral and then swap these stablecoins for more crypto, against which they can borrow even more. By ‘looping’ their leverage these traders are betting that increased upside exposure will compensate for their cost of borrowing. The opening of these leveraged positions creates buy pressure but also increases credit utilisation, driving both prices and rates higher.
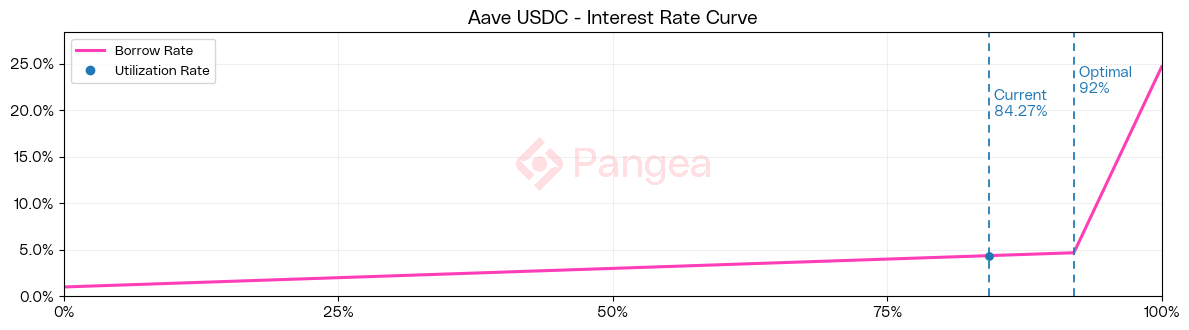
Aave's interest rate curve defines the relationship between utilisation and rates. Rates rise gradually with increased utilisation until the kink is reached, after which they climb rapidly. This results in steep but short-lived spikes in rates during periods of overutilisation, which occur during periods of speculative mania when traders are willing to pay a high price for leverage, whilst lenders demand a higher compensation for the opportunity cost of providing liquidity. Higher rates incentivise borrowers to close and lenders to provide liquidity, mitigating against liquidity becoming trapped for sustained periods.
In an overheated market, the sell pressure caused by the unwinding of a few large looped positions can result in a cascade of liquidations, forcing a further unwinding of credit. In this way, an overheated market can rapidly combust into a hasty deleveraging event. What goes up, must come down!
Taking the Temperature
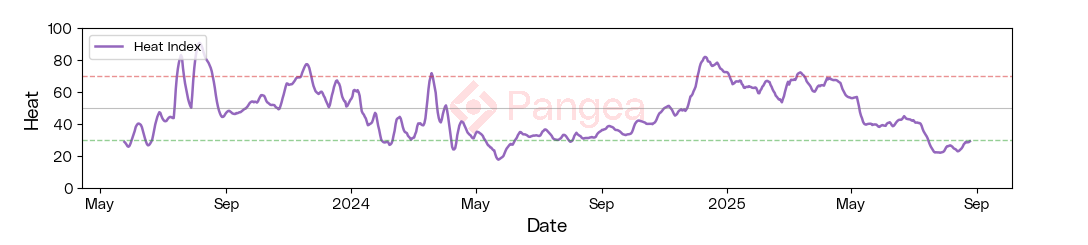
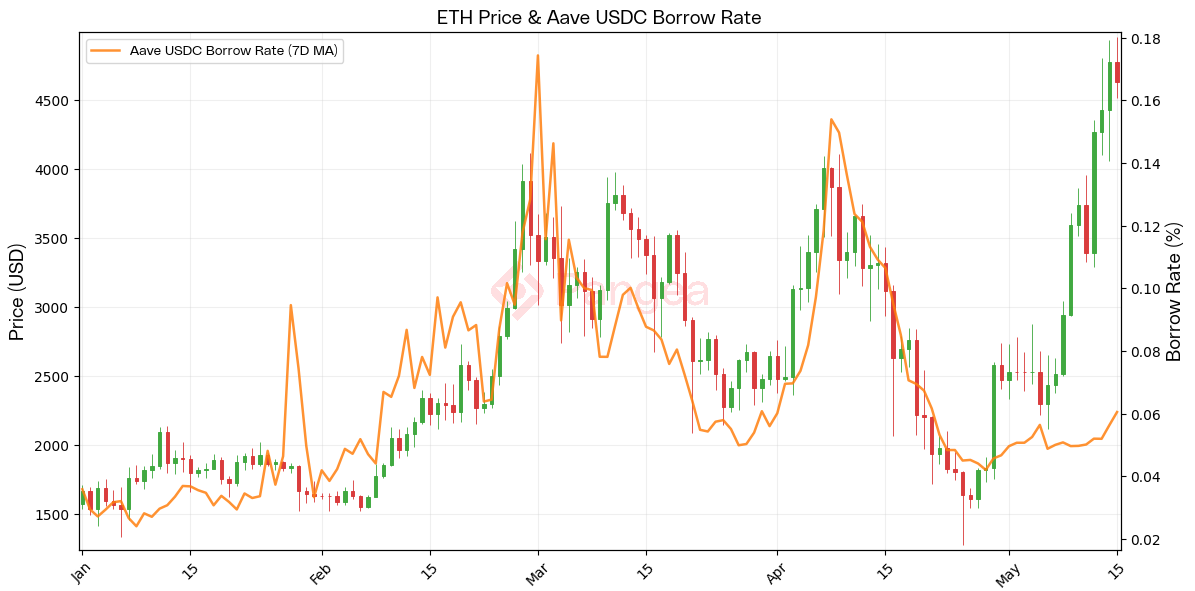
We believe we are witnessing the emergence of crypto credit cycles that are partially (but not wholly) untethered from the wider TradFi credit cycle, with Aave USDC leading as the de facto 'risk-free' rate. As can be seen in the below chart, historically rises in the ETH price have been accompanied by rises in the borrowing rate, with peak rates usually marking a local top and troughs marking a bottom. Reading into this pattern, we see that the price rises in late 2023 and 2024 were mostly driven by leverage, with traders unwinding positions once the market became overheated.
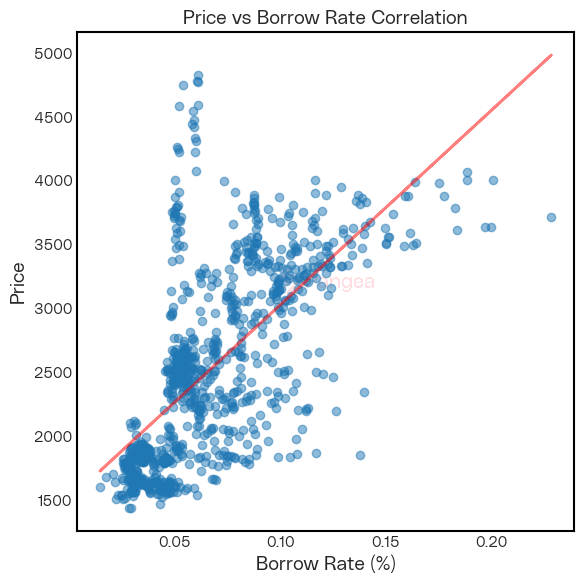
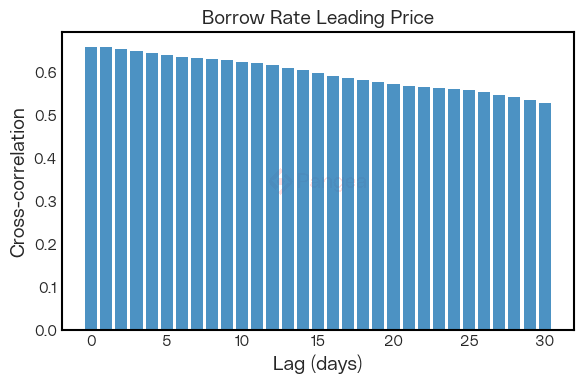
We observe a positive correlation between the Aave USDC borrow rate and the ETH price (Pearson: ~0.66, Spearman: ~0.77). As we push rates forwards, the correlation decays slowly but stays positive and high, implying that rates contain persistent information about the regime of the market. Whilst we might not be able to use borrowing rates to predict short-term price movements, they can be a useful indicator of overall risk in the market.
Interestingly, ETH's recent rise from the April lows of $1540 to this week's all-time high of $4950 breaks this pattern, with rates remaining below average. A bullish interpretation (we consider others towards the end of this article) is that this recent rally is different, being driven by institutional spot buying through ETFs and treasury companies rather than on-chain leverage. Whilst TradFi hoovers up ETH supply, the degens remain sidelined. This could imply that this rally still has a lot further to go, with the credit market still offering cheap money for the apes to FOMO in at higher prices. Maybe we’re just getting warmed up!
We wanted to translate these intuitions into a usable indicator to take the temperature of the market and find out just how unusually low rates are right now, based on the past history of prices and rates. To this end, we are pleased to present our DeFi Heat Index:
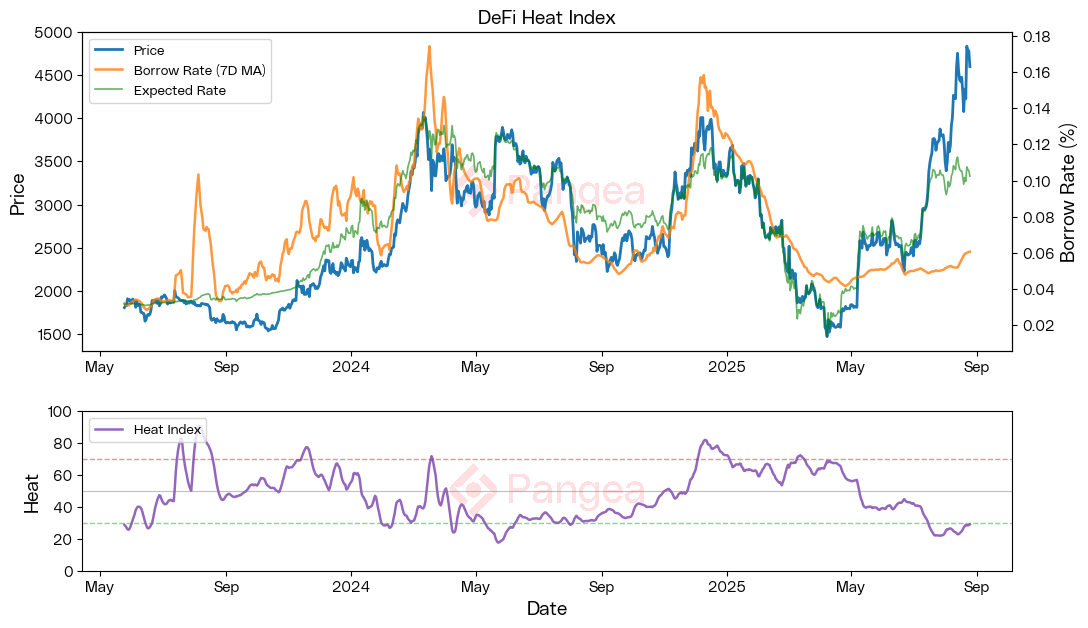
The index takes a rolling lookback at rates relative to price to determine where, given historical trends, we would expect rates to be. The index shows current rates to be at historically low levels relative to what we might expect given recent price rises. We suggest reading the indicator as follows:
When rates are higher than expected the market is overheated. The cost of maintaining the leverage in the system cannot be maintained, whilst at the same time the risk-return ratio of ETH is diminished relative to money markets. This dangerous combination often precedes a downturn. As positions unwind, the flow of liquidity out of ETH and into money markets allows the market to cool off, with valuations and rates falling back to earth during a recovery phase.
When rates are lower than expected the market is cool. The system is clear of leverage and risk appetites can begin rising as cheap money seeks higher returns outside of money markets. This usually indicates the beginning of a new cycle and a good buying opportunity. A combination of rising prices without rising rates is interpreted as bullish, because it implies that the credit market can sustain further extension.
We chose Aave USDC as our reference rate as this is the deepest, most mature, and most trusted stablecoin lending market, with over $6.1bn supplied and $5.1bn borrowed. We believe this has become DeFi's low-risk rate, providing genuine signal about the state of on-chain credit without the noise of short-term incentives and idiosyncratic events seen in other markets. We chose ETH rather than BTC as our source of prices given that ETH is the main asset used as collateral in DeFi, although similar results can also be obtained for BTC. Our parameters for the lookback period (365d), z-score (1.5), and moving averages (7d) were determined by simulating sweeps to see which values had the greatest predictive power.
Hidden Risks
In closing, we highlight some limitations of the index and alternative conclusions that could be drawn from our results.
Firstly, we must stress that the DeFi Heat Index is not intended to be used as a standalone trading signal. A simplistic reading of cool = bullish, hot = bearish does not hold: May-June 2024 marked a bottom for the heat index and a local top for the ETH price, whilst April-May 2025 saw a relatively hot market, despite sharply declining prices. Our backtesting has shown that buying cool and selling hot, whilst generally profitable, does not outperform the market or offer any noteworthy downside protection. But we do believe that the Index serves as a valuable indicator of market risk and positioning in the market cycle. When used in combination with other indicators it can provide essential context and empower better-informed decision making.
An obvious limitation to the Index is that it does not consider off-chain credit. Whilst DeFi rates can serve as a proxy, we do not expect off-chain credit risks to necessarily be reflected in the on-chain data. It may well be that the current rally is driven by new sources of off-chain credit that have opened up in the TradFi markets, such as treasury companies leveraging their shares à la Microstrategy. The availability of off-chain credit lines may actually be playing a role in keeping on-chain rates low.
Another key limitation is that we do not consider funding rates for perpetual options. On-chain perp platforms like Hyperliquid are arguably now the preferred method for DeFi traders seeking leverage, so it’s possible that we are simply seeing a shift in preferences for different leverage products, rather than a cooler market. Whilst we would expect to see perp open interest spilling over into lending rates, these are entirely different products and we cannot assume a direct relationship. A similar indicator measuring perp OI heat could be a valuable addition.
An alternative reading of the current market is that rates are relatively low not because of a lack of demand for borrowing, but rather because of a glut of stablecoin liquidity. With stablecoin TVL reaching all-time highs of $277bn among rising adoption from institutions there is more liquidity than ever before seeking a home. Moreover, whilst leverage on volatile crypto has historically been the main driver of borrowing, looped leverage stablecoin farming strategies are creating new sources of demand that are not necessarily reflected in rising crypto prices. These emerging trends in the supply and demand for on-chain credit warrant further investigation to accurately interpret the Index.
Calling All Risk Analysts
We invite further research into risk indicators and market analyses focused on understanding on-chain credit. If you are interested in using Pangea’s data to power your risk analysis, join our Discord community and reach out to us.