
Does YieldBasis Benefit Curve?

As YieldBasis prepares to scale with a proposal to raise pool caps, we investigate whether predictions about its beneficial effects for the Curve DAO hold true.
In summary, we found:
- Every $1 traded on YieldBasis generates at least $1.089 volume on Curve
- >88% of this volume was due to crvUSD swaps
- YieldBasis has a disproportionate impact in increasing Curve’s market share
Introduction
YieldBasis is the latest project from Curve founder Michael Egorov, launching on Sep-24. It introduces a new Leveraged AMM which aims to eliminate impermanent loss on BTC/USD pairs. A key component in the system is a private credit line of crvUSD provided without borrowing charges by the Curve DAO, which is used to supply stablecoin to the pools and keep leverage constant.
Egorov's proposal to the Curve DAO requesting the initial $60m credit made the case for primary and secondary benefits of YieldBasis for Curve. The primary benefit is that Curve will receive 20% of all YB emissions. Secondary benefits include creating a supply sink for crvUSD and generating additional volume on Curve from arbitrage routing.
Mich explains how Curve is expected to receive equivalent volumes from YieldBasis trades:
Yield Basis earns fees from BTC wrapper trades, for example BTC<->crvUSD. However, crvUSD is rarely the final stablecoin users (mostly arbitrage traders) need. Typical arbitrage paths can look like:
wBTC->crvUSD->USDT or USDT->crvUSD->WBTC.
Therefore, the same volume as happening in wBTC<->crvUSD pool (which has no admin fee) also occurs in crvUSD<->USDT and similar pools. Those trading volumes contribute to system revenues.
In this article we investigate these claims to see whether YieldBasis does in fact generate an equivalent amount of volume on Curve. We also looked at how YieldBasis interacts with Uniswap to better understand flows that aren’t routed through Curve.
Methodology
A summary of the methodology used to obtain the dataset for our analysis is as follows:
- Fetch all swaps on YieldBasis pools (crvUSD/WBTC/ crvUSD/cbBTC, crvUSD/tBTC) from Pangea up to 23:59 on Oct-5.
- For every transaction with a YieldBasis swap, fetch all swaps on Curve and Uniswap V2, V3, V4 from Pangea.
- Use Pangea’s Dollarise feature to price all tokens.
- Run our flow analysis algorithm to attribute volume generated by YieldBasis swaps to Curve and Uniswap.
To answer the question of how much volume YieldBasis generates for Curve, we need to identify swaps on Curve that can reasonably be attributed as being due to a swap on YieldBasis. With the rise of DEX aggregators, solvers, and MEV bots, most swaps are complex transactions routing through many different pools and protocols to achieve optimal execution. Transactions often split off into several threads before being consolidated back together again, and batch solving can process multiple unrelated swaps for different users. As a result, parsing the flow of value through a transaction can be far from simple.
To accurately attribute flow, we use a multi-hop greedy accumulation method that assigns a budget to each YieldBasis swap which can be consumed by contiguous legs within that transaction. The budget propagates transitively in each direction, meaning that the upstream leg now has a budget which is consumed by further upstream legs, and so on. In this way, we account for multiple hops and always trace the flow wherever it goes, but we never count more on each leg than the nominal value of the YieldBasis swap and we don’t count anything for unrelated swaps which just so happen to be in the same transaction. For example, if a solver consolidates unrelated swaps into $100k USDC and then swaps this through USDC/USDT, our methodology ensures that we only count $1000 from this consolidation if that’s all we can directly attribute to the YieldBasis leg.
Under this methodology, the maximum attributable volume from a YieldBasis swap can be calculated as:
YieldBasis volume * (number of upstream + downstream legs)
For example, a complex swap of 1000 USDC for tBTC through YieldBasis might look like:
USDC->USDC/USDT->USDC/crvUSD->crvUSD/cbBTC->cbBTC/tBTC->tBTC
In this case, we attribute all of the volume from the upstream and downstream legs of the YieldBasis crvUSD/cbBTC swap, which has a nominal value of ~$1000. The nominal value of the two upstream legs (USDC/USDT and USDC/crvUSD) is ~$1000 each, whilst the downstream cbBTC/tBTC leg is valued at ~$1000. Supposing that the USDC/USDT swap happened on UniV3 and the others were on Curve, we would attribute ~$1000 to UniV3 and ~$2000 to Curve. That is, every $1 swapped through YieldBasis in this transaction resulted in $1 of flow through Uniswap and $2 through Curve.
A recent post by Curve data wizard benny finds a similar proportion of trades with associated Curve volume to us, however due to a difference in methodology we attribute significantly lower volumes to many of the transactions. Benny counts any volume on other Curve pools during the same transaction for the tokens traded in the YB pool. But as we found, this will include volume from swaps which are unrelated to the YieldBasis leg and so overstates the attributed volume.
Our approach is inherently conservative as it prioritises avoiding misattribution of unrelated flows. For example, we do not account for volume generated by MEV in nearby transactions, and some of the volume classed as unrelated may actually have some indirect association. As a result, our results should be taken as a lower bound.
Findings
Raising the pool caps from $1m to $10m marks distinct before and after phases in our dataset. Volumes dramatically increase as we begin to see a much higher frequency of swaps.
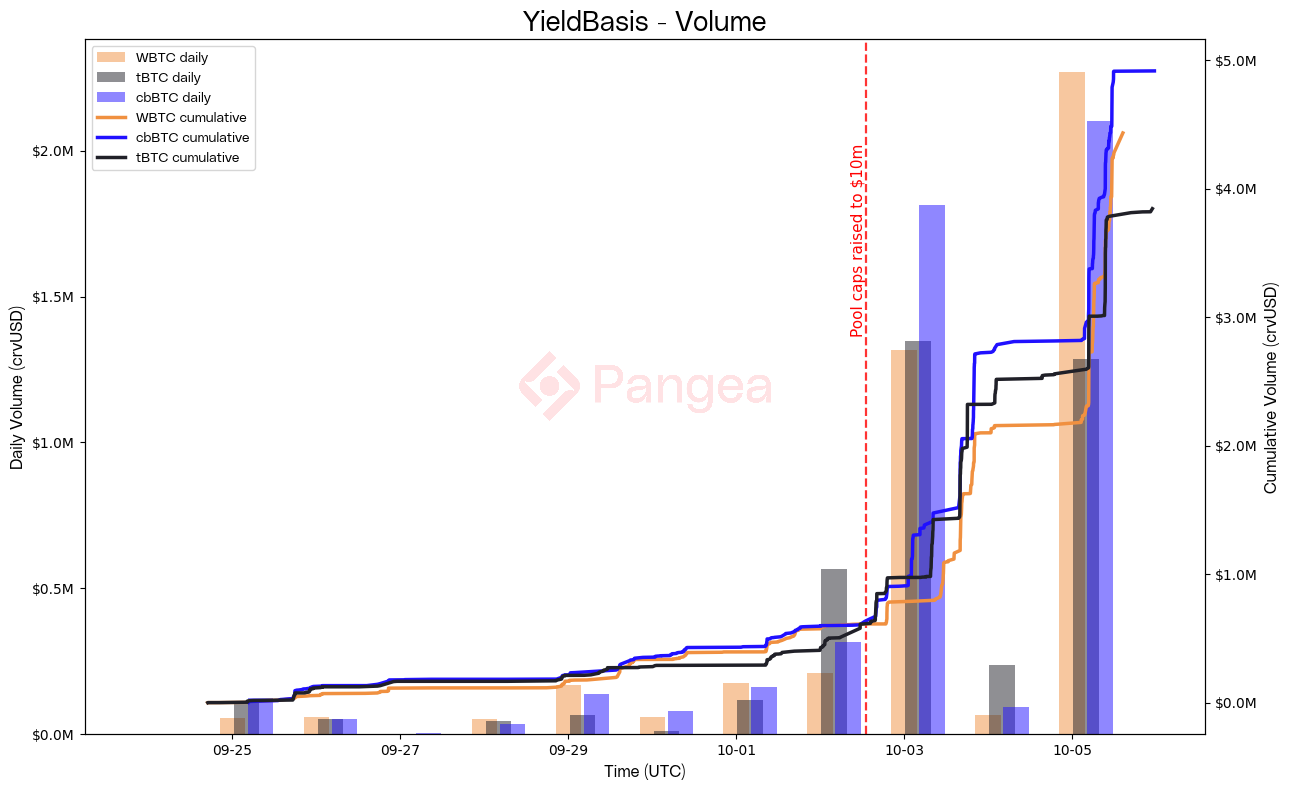
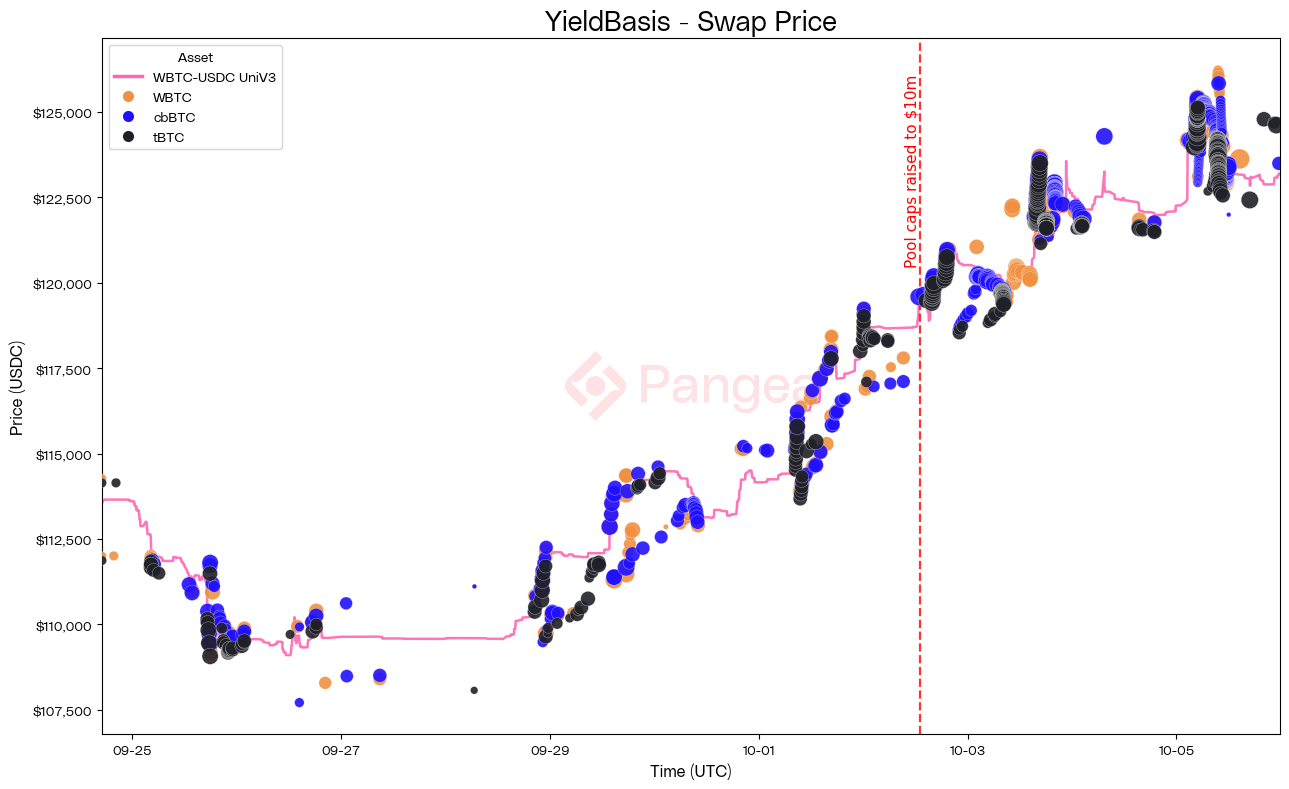
Due to the relatively high 1% fee, volume is almost completely flat when there is low volatility (e.g. Oct-4). Only once there is a significant move in the BTC price do we see volume pick up, which is evident in the vertical groupings of swaps with empty gaps in between, compared with the more consistent Uniswap reference.
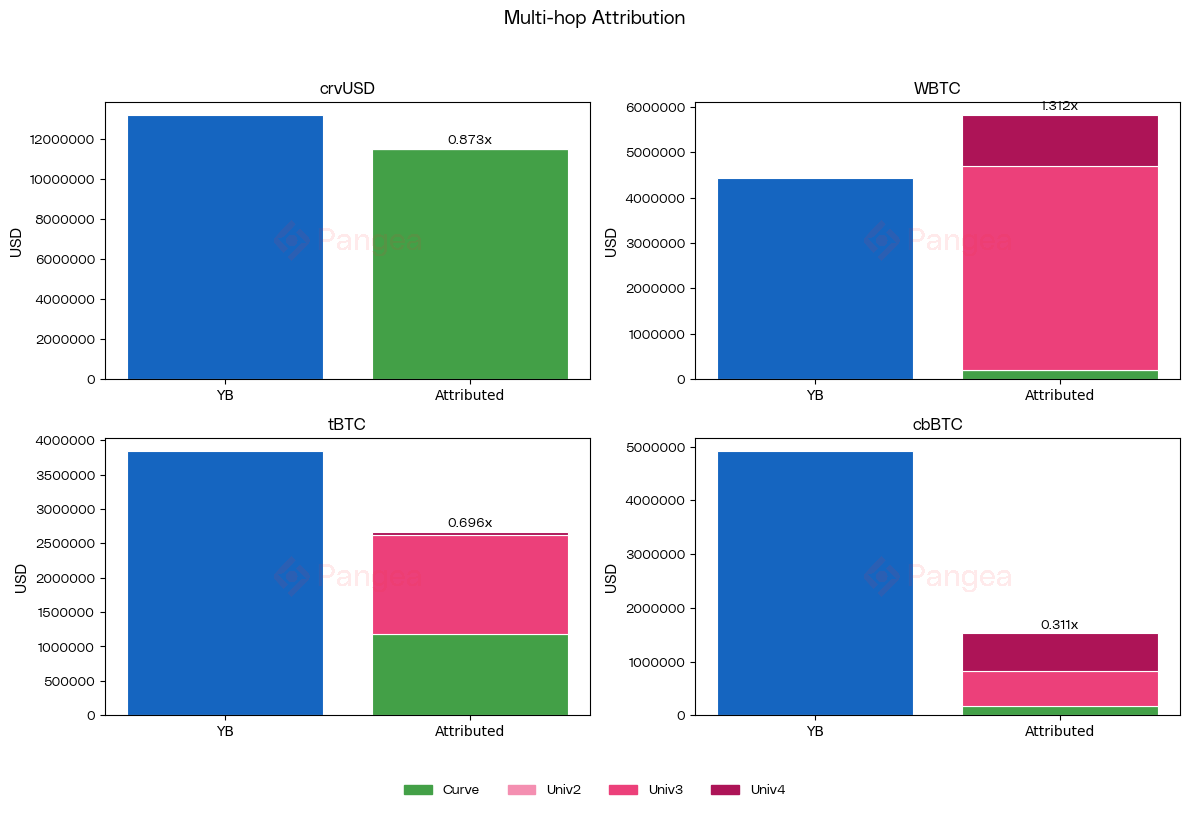
The following table breaks down the attribution of volume across Curve and Uniswap for all transactions containing YieldBasis swaps:
We can see how these volumes grow over time in the following chart:
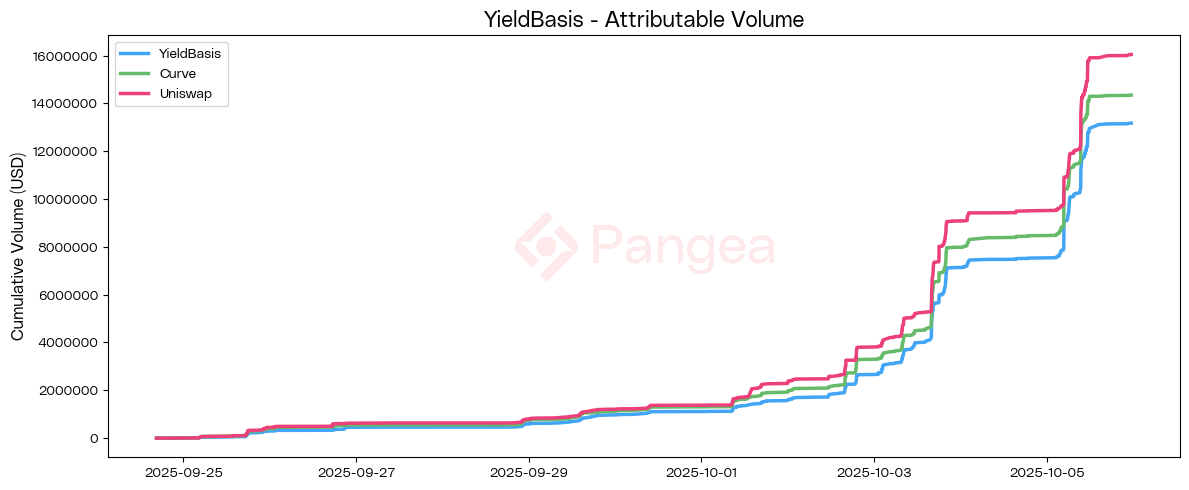
Every $1 traded on YieldBasis is generating at least $1.089 volume on Curve, which is greater than the 1:1 ratio predicted by Egorov. This proportion increased after the caps were raised, which implies that the economies of scale in play are favourable to the flow through Curve.
We looked at the single-hop capture of volume across Uniswap and Curve to understand how this routing breaks down. In this analysis, we only count the contiguous swap, e.g. buying crvUSD to swap crvUSD/cbBTC on YieldBasis, and we ignore any additional hops (which account for an extra ~$1.3m on Curve). We see that almost all of the crvUSD traded on YieldBasis is routing through Curve; here we include the buying and redeeming of scrvUSD, which was a prevalent route. Interestingly, a small portion of this volume routes through Curve’s LLAMA pools, which power its Lend and Mint markets. The ‘Other’ remainder here is due to traders who already began with crvUSD in their wallet, or who ended by holding crvUSD; as this was also acquired on Curve (either through swapping or borrowing), we may conclude that essentially all crvUSD volume on YieldBasis is going via Curve - there is no competition. tBTC also saw noteworthy volume routing via Curve, which remains competitive, however for WBTC and cbBTC Uniswap was dominant. We did not investigate the breakdown of the ‘Other’ here; either it is routed through other DEXs or the traders began/ended with these coins.
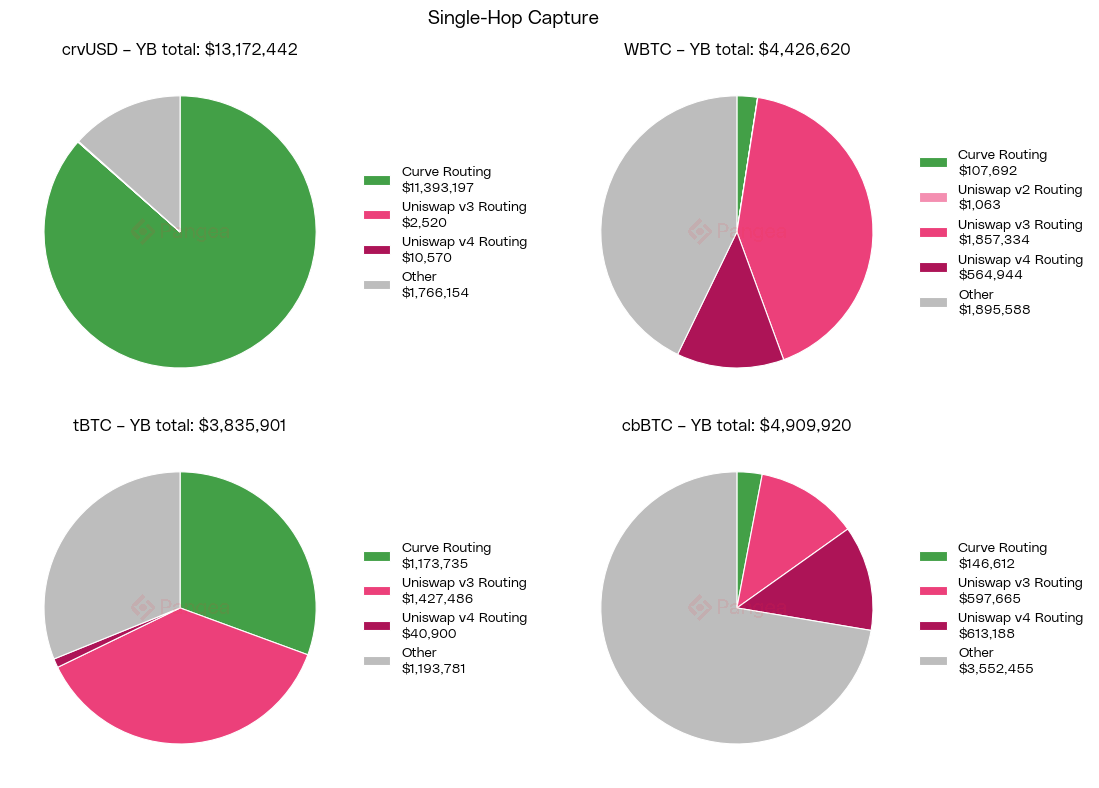
When factoring in multiple hops involving the tokens traded on YieldBasis, we see the WBTC share on Uniswap V3 increases considerably, exceeding the value of the originating YieldBasis swaps. This is corroborated by our other datapoints and is indicative of downstream routing to close out trades into USDC / USDT.
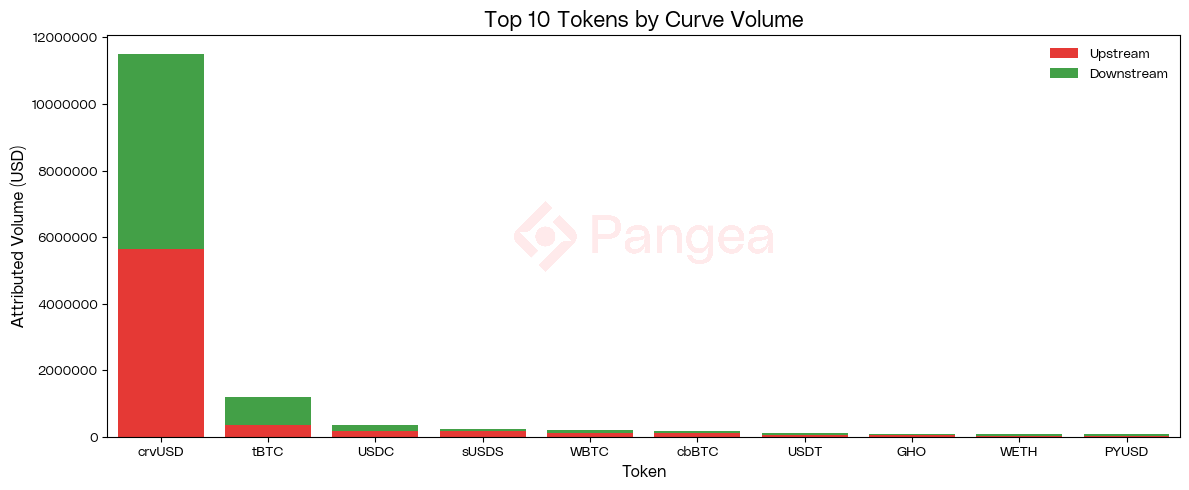
Looking at the breakdown of upstream / downstream routing by token, we can see that crvUSD accounts for >88% of Curve’s attributable volume. The balanced proportion of downstream / upstream volume shows that traders consistently route through Curve’s crvUSD pools on their way in or out of YieldBasis.
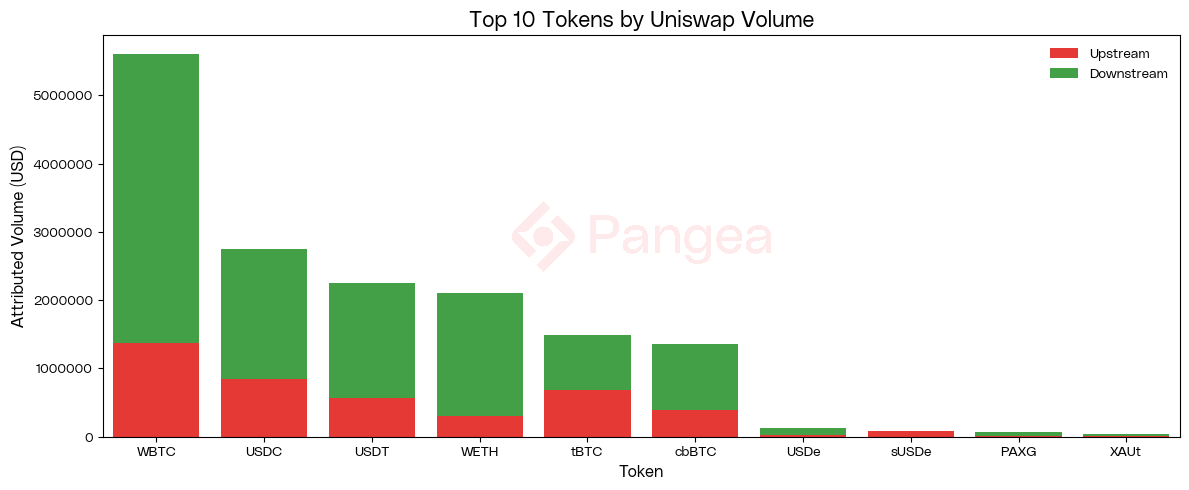
In comparison, Uniswap’s volume is skewed to the downstream side and is mostly accounted for by WBTC, USDC, USDT, and WETH. This is due to arbitrage traders buying WBTC on YieldBasis and then closing out their trade on Uniswap.
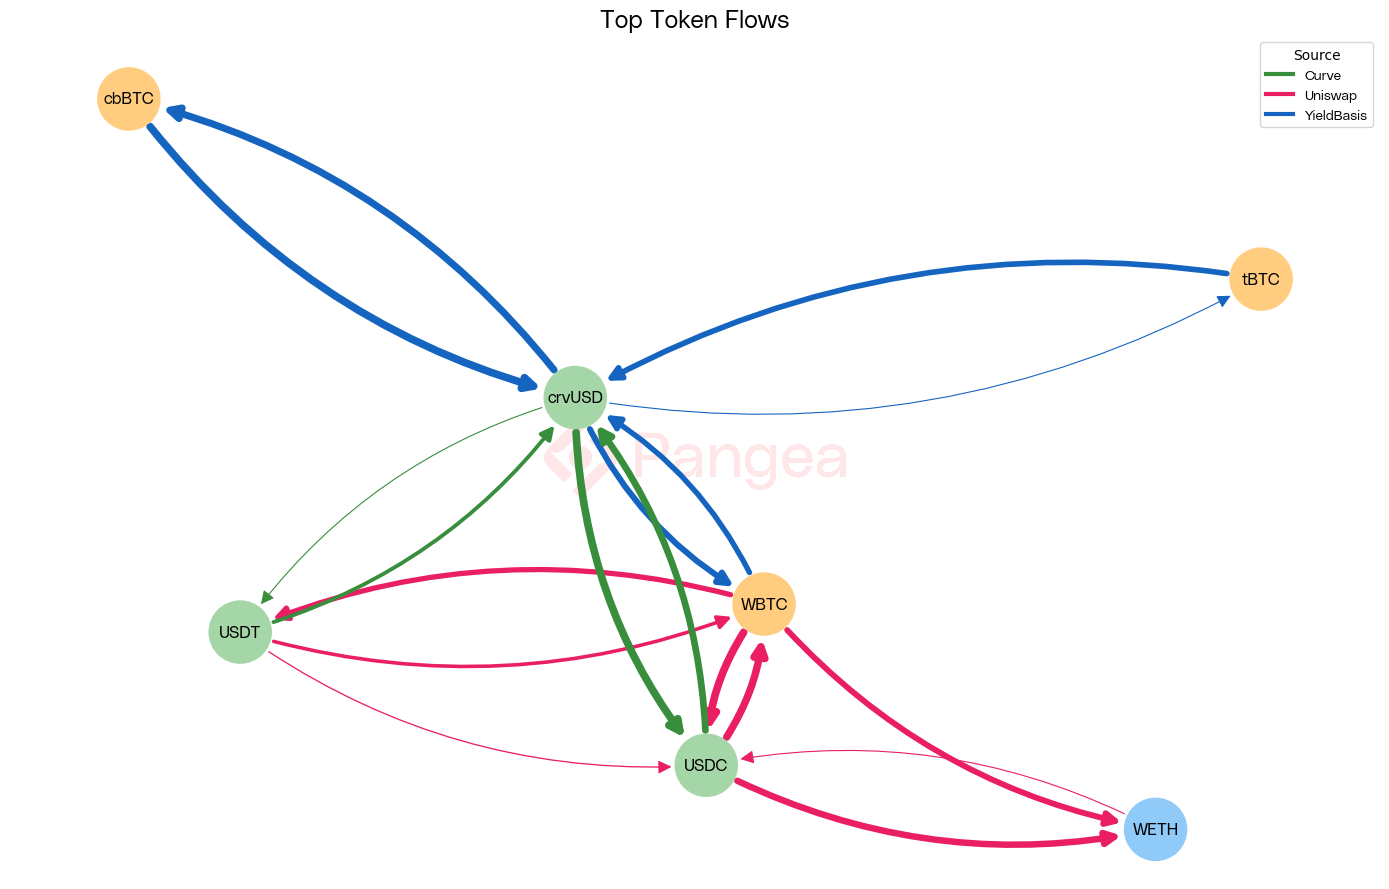
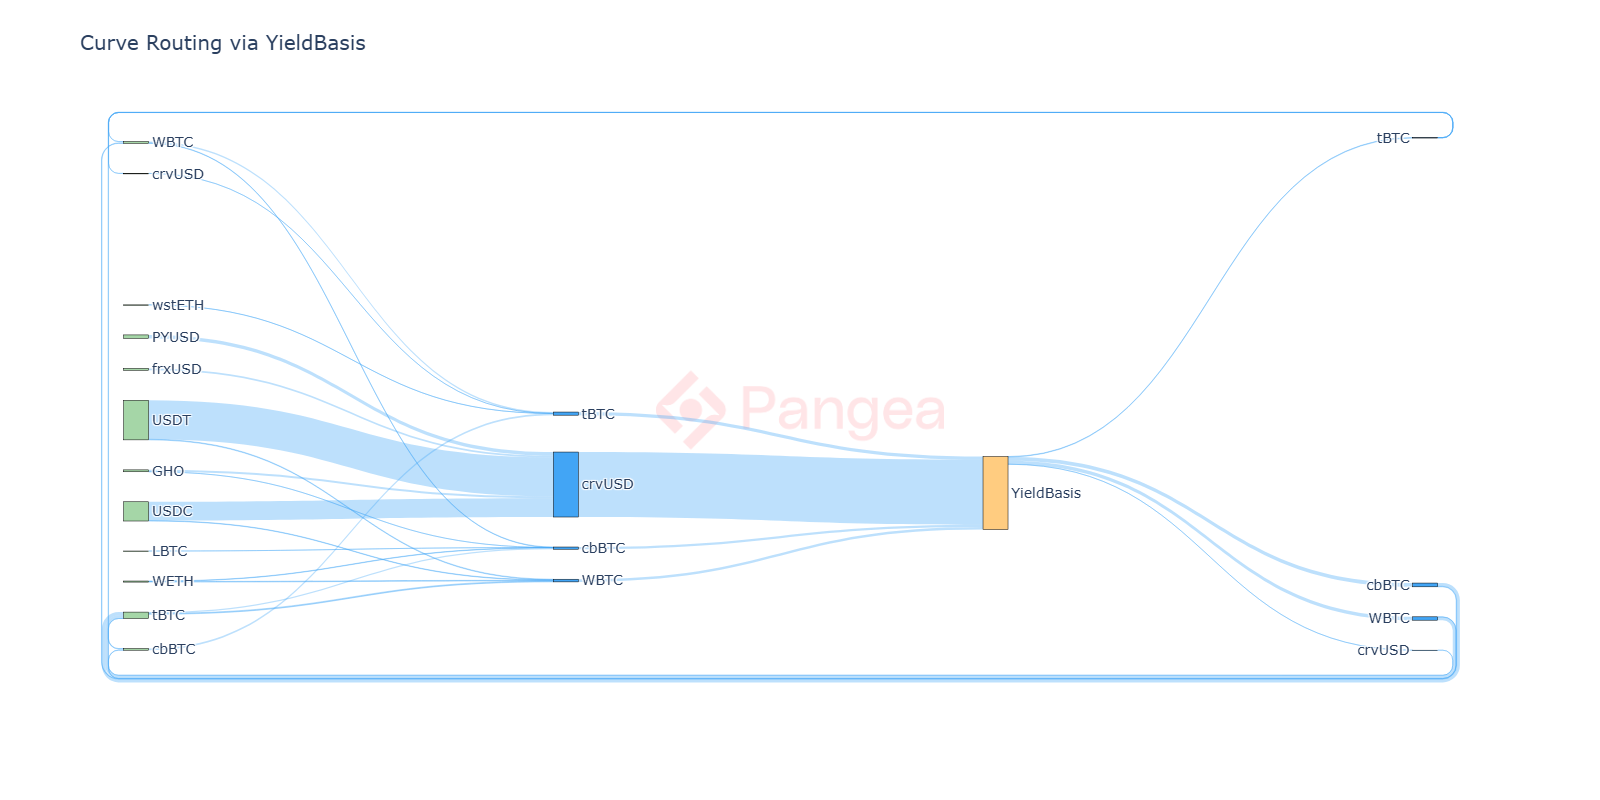
This is further validated by looking at token flows in a network diagram. We see that Curve dominates the stablecoin swaps for crvUSD, whilst Uniswap’s volume is centered around volatile swaps of WBTC for other tokens.
Visualising these flows using a Sankey diagram, we show tokens that were swapped in upstream upstream legs on the way into YieldBasis, and downstream legs on the right. We observe multiple stablecoins feeding the crvUSD ingress, which is the dominant entry point via Curve. The downstream looping back into the upstream tokens is due to arbitrage between YieldBasis pools, in which Curve’s tBTC/WBTC and tBTC/cbBTC pools serve as a bridge and have seen increased volume since the launch of YieldBasis.
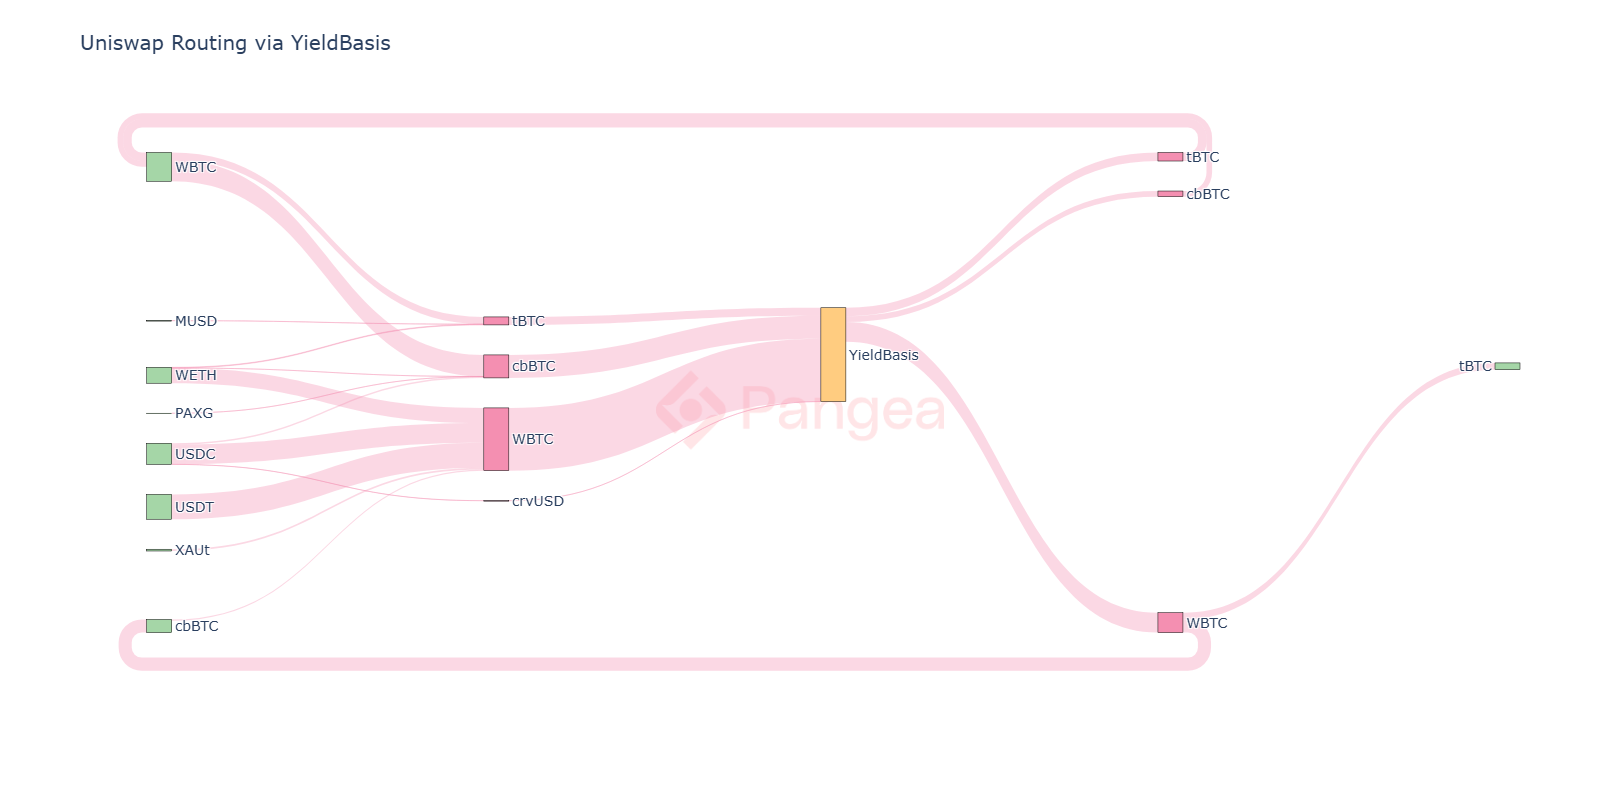
Comparing against Uniswap, we see the relative dominance of WBTC, which is fed by USDC, USDT, and WETH. These results align with expectations - Curve picks up the stableswap routing, whilst Uniswap takes volume on volatile pairs.
We provide the following plots for a direct comparison with benny’s, which showed significantly higher outliers. This is because his methodology attributes all Curve volume in the same transaction, whilst we only attribute what can be directly related to the YieldBasis swap.
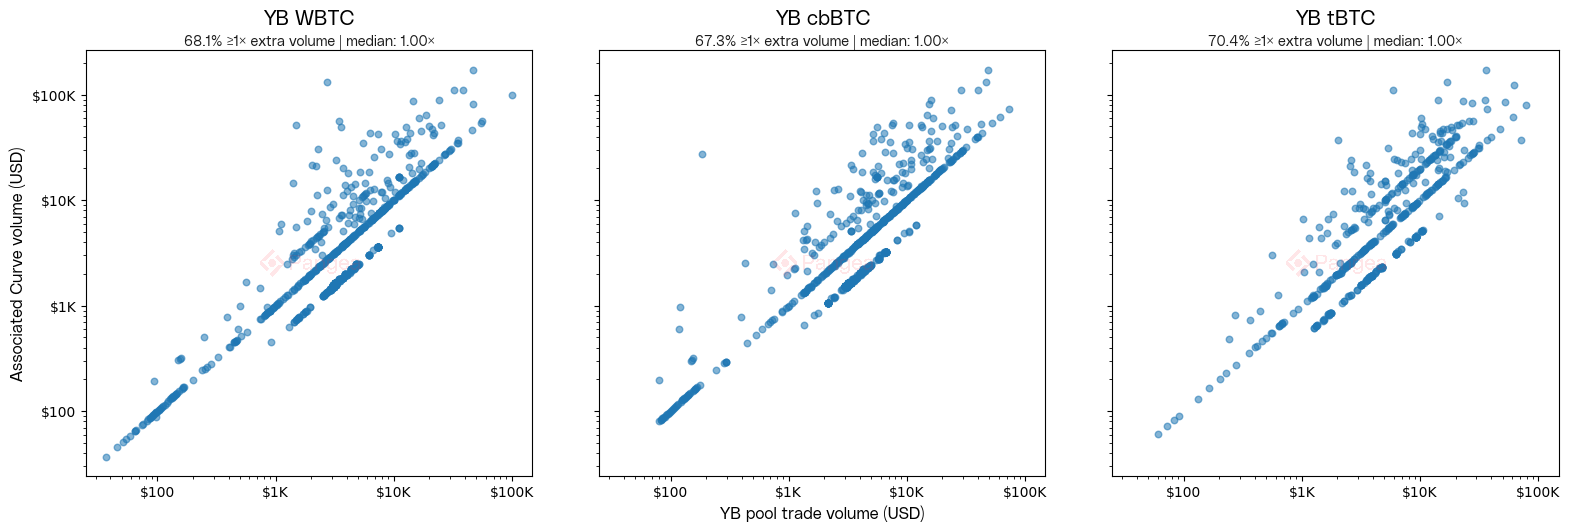
The banding above and below the median is an interesting artifact of our methodology. Each point compares the total YieldBasis volume in that transaction against the total attributable Curve volume. The points below the median are where there are two YieldBasis swaps in one transaction, only one of which has a Curve leg. The band above the median is where a YieldBasis swap has two Curve legs; in fact, all points above the median are due to multiple legs or hops. Note also that transactions with $0 attributable volume are not plotted. All three pools have a median of exactly 1× due to the overwhelming majority of the transactions having a single Yieldbasis swap with a single Curve leg of equal value.
An incorrect conclusion to draw from this analysis is that YieldBasis benefits Uniswap more than it does Curve, because the attributed volume there is higher. Firstly, Uniswap’s overall volume is higher, so it’s unsurprising to see it routing a lot of volume here. What is remarkable is the over-representation of Curve relative to its market size and the disproportionate engagement with YieldBasis. This table breaks this down:
Curve’s share of the analyzed swaps is 2.7× larger relative to its normal market volume share relative to Uniswap. Moreover, Curve’s attributable share is 1.57× higher; that is, half of Curve’s volume in the analysed transactions is tied to YieldBasis, compared with only one-third on Uniswap. This means that YieldBasis contributes far more intensively to Curve’s activity relative to its baseline size. Curve is a greater beneficiary than Uniswap not because of scale, but because of depth of participation.
Secondly, whilst this analysis shows that YieldBasis is generating volume for Uniswap, it doesn’t look at how much volume is being siphoned away. It’s too early to take a meaningful measure of this, but we speculate that once running at scale YieldBasis could increasingly take away Uniswap’s market share for BTC<>USD swaps. So whilst some volume is gained, it is lost elsewhere, and on net we expect YieldBasis to have a negative effect on Uniswap’s market share. There has been speculation that YieldBasis will similarly take away BTC<>USD volume from Curve’s Tricrypto pools, which also seems likely. But as Curve’s BTC<>USD volume has historically been much lower, what it loses here is more than made up for by the extra stableswap volume (including BTC stableswap pairs). We also note that the majority of Uniswap’s attributable volume was from downstream WBTC swaps, typically from traders closing out into USDC or USDT. If YieldBasis and Curve can work together to make this closing leg more efficient then there is an opportunity to capture an even greater share of the overall volume.
Conclusions
Our findings substantiate one of Egorov's key hypotheses about the benefits of YieldBasis for the Curve. YieldBasis induces systematic routing through Curve, with trades often making multiple hops, generating additional volume and fees for the Curve DAO. This volume primarily comes from swaps through crvUSD stableswap pairs. In fact, the total attributable volume exceeds expectations, generating more than the predicted $1 of Curve volume for every $1 traded on YieldBasis.
Our findings are conservative due to our strict flow attribution methodology, so the volume attributed to Curve should be read as a lower bound. It’s possible that the overall benefit is even greater, if we account for more indirect effects.
An unexpected finding was the role of BTC stableswap pools in YieldBasis arbitrage. These pools provide an efficient bridge between the YieldBasis pools and have seen increased volumes since its launch. A new cbBTC/WBTC pool on Curve may be justified if arbitrage volumes continue to scale, as currently this path has to route through two tBTC pools. We also note that some of the crvUSD volume came from Curve’s Lend and Mint markets, and it will be interesting to observe whether YieldBasis becomes a primary route for liquidating BTC collateral.
The findings regarding Uniswap’s capture of volume on volatile pairings are within expectations and provide actionable insights. Capturing these higher fee flows could add significantly to Curve's revenue and market share. The new efficient Twocrypto pool implementation used by YieldBasis may play an important role in capturing these flows through new volatile pools.
As YieldBasis scales there are some interesting dynamics suggested by saintrat that we will be looking out for. Firstly, it's possible that arbitrageurs may begin holding crvUSD inventory to avoid paying fees on this leg of their trades, which could negate the majority of the Curve volume generated by YieldBasis. Secondly, we may see the emergence of crvUSD pools on other DEXs with competitive fee rates. These third-party pools could be a source of value leakage for Curve, whose vertical integration of crvUSD has hitherto succeeded in capturing a large portion of its value chain.
With only two weeks in production and three pools capped at just $10m YieldBasis is still in its infancy. Economies of scale mean that a full evaluation can only be made once the pools achieve deeper liquidity. More time is needed before we can achieve a meaningful analysis of how much BTC<>USD volume YieldBasis is siphoning away from other venues. Until then, our study can only provide premature indications. Despite this, we believe our findings are significant, as they point to systematic behaviours which we expect to continue as YieldBasis scales.
In closing, YieldBasis appears to be highly complementary to Curve, driving net-new volume by routing through crvUSD to exploit a market segment (volatile pairings) in which Curve has historically not been as competitive. We conclude that YieldBasis is a net-positive for Curve’s DEX volume and that Egorov’s predictions have been entirely substantiated by our findings. Our research provides important data points to guide the Curve DAO’s decision making on Egorov’s recent proposal to raise the crvUSD caps to $300m.
Calling All Analysts
Pangea has been streaming realtime data from all YieldBasis contracts from day 1. This was made possible by the new Pangea Studio, which is Claude Code for crypto data, leveraging a SQL syntax and AI assistant to make building new datasets from scratch easier than ever. These datasets can be combined, as we've done here with Curve, for complex cross-protocol and comparative analysis. Our Dollarise feature provides robust DEX pricing that enables cross-asset comparisons and volume calculations. Answering questions about a protocol is as simple as asking our Explore Agent, who can provide detailed charts and reports with full historical context in an instant.
If you want to learn more about how Pangea Studio can help you build faster and better, or you are interested in giving your users transparent access to your protocol’s data through our Explore Agent, join our Discord and get in touch!